The Royal Navy’s Size Throughout History
Throughout the Georgian, Victorian and Edwardian eras the Royal Navy boasted the largest and most powerful fleet in the world. From protecting the Empire’s trade routes to projecting Britain’s interests abroad, the ‘Senior Service’ has played a pivotal role in the nation’s history.
But how does the current strength of the Royal Navy compare with the days of Empire?
Pulling data from a number of different sources and using some nifty data visualisation tools, we’ve been able to paint a picture of how the strength of the Royal Navy has ebbed and flowed as far back as 1650.
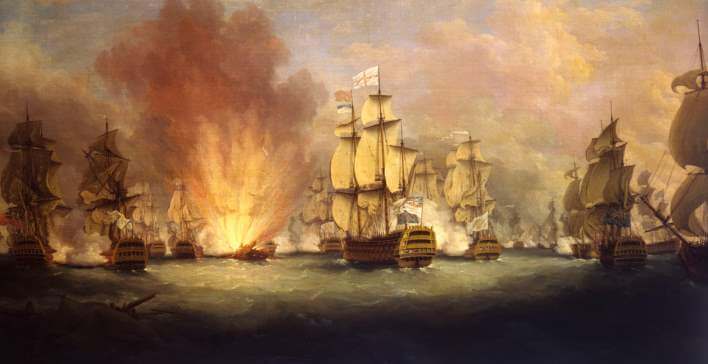
Above: The Royal Navy engaged at The Battle of Cape St Vincent, 16 January 1780
So without further ado, let’s take a look at the overall number of ships in the Royal Navy since 1650. Please note that this first graph includes smaller coastal patrol vessels as well as larger vessels such as battleships and frigates:
As you would expect, the size of the fleet peaked during the First and Second World Wars as Britain’s war machine quickly ramped up production of ships. Unfortunately the sheer number of ships during 1914-18 and 1939-45 completely skews our graph, so for the sake of clarity we’ve decided to strip out the two World Wars and – whilst we’re at it – take out coastal patrol vessels from the mix.
So what does this graph tell us? Here are a few interesting insights we’ve managed to extract:
- With coastal patrol vessels excluded, the number of significant ships in the Royal Navy has declined by around 74% since the Falklands War.
- Even with coastal patrol vessels included, the number of significant ships in the Royal Navy is 24% less than in 1650.
- For the first time since the World War One, The Royal Navy is currently without any aircraft carriers (although the new Queen Elizabeth class carriers are due to come into operation in 2018).
Finally, we thought it would be interesting to take a look at military spend as a percentage of GDP (gross domestic product, or the total ‘money’ a nation generates each year), and to overlay this with the size of the Royal Navy through the years.
Again, here we can see a massive spike in military spend during the First and Second World Wars. In fact, by the early 1940’s over 50% of Britain’s GDP was being spent on the war effort!
Current military spend as a percentage of GDP sits at 2.3% which – although low by historic standards – is not the lowest ever. That honour goes to 1700 where, during the reign of William and Mary, military spend could be temporarily lowered thanks to the incorporation of William III’s Dutch naval vessels into the British navy.
We need your help!
Although we’ve made every effort to ensure that the data used on this page is as accurate as possible, we’re also aware that we’re not perfect. That’s where you come in…
If you note any inaccuracies or know of any data sources which could help improve this page, please get in contact with us via the form below.
Sources
https://www.gov.uk/government/uploads/system/uploads/attachment_data/file/378301/2014_UKDS.pdf
https://www.telegraph.co.uk/news/uknews/1538569/How-Britannia-was-allowed-to-rule-the-waves.html
https://www.ukpublicspending.co.uk
https://en.wikipedia.org/wiki/Royal_Navy
Uk Defence Statistics 2004